Quantest

AI analytics for the NSE

Equity and F&O analytics built on our own tick-by-tick record of the exchange feed, so every number on a screen can be checked back to the data that produced it. No tips, no calls, no performance claims.

Equity analytics · NSE cash500 symbols
Resolutionsdaily · weekly · 15m · 5m
AI chart patternstops, bottoms, head and shoulders, wedges
AI candle patternson daily and weekly history
Beside every rowbeta, against NIFTY 50
Also on the screenindex constituents

An illustration of the screens, not a recommendation and not a result. We publish no returns and no performance figures — here is why.

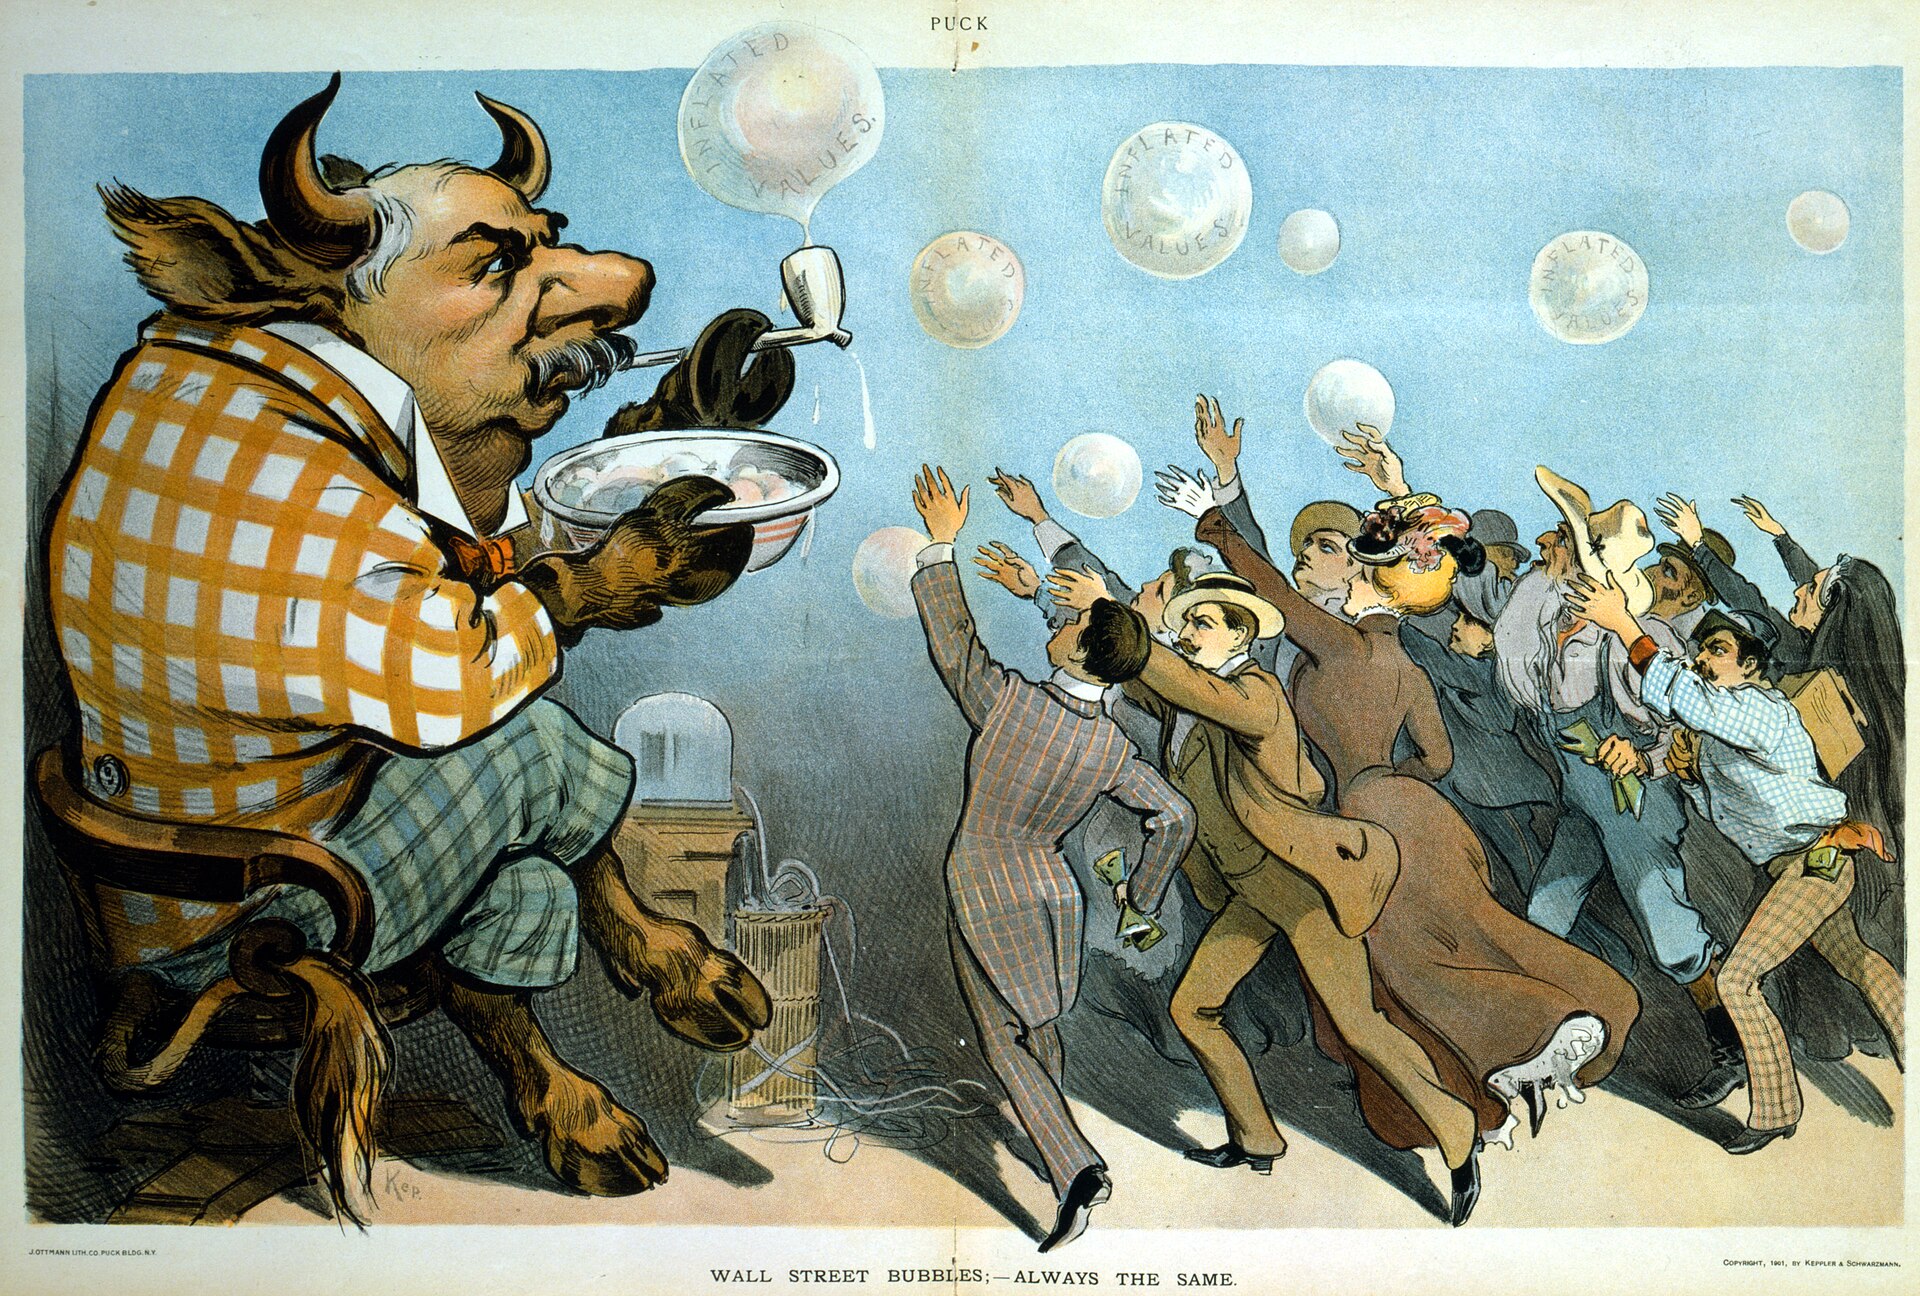
A 1901 colour lithograph: a bull in a checked coat blows soap bubbles labelled “inflated values” while a crowd of people reaches up to catch them.
“Wall Street bubbles — always the same”, Udo Keppler for Puck, 1901. The promises are not new. What is new is being able to check them. Public domain

What the platform does

Five services on one data foundation: our own record of the Indian market, recorded tick by tick, stored as our own candles, and checked every night before anything is called current.

Equity analyticsNSE cash
UniverseNIFTY 500
Chart patternsdaily, weekly, 15m, 5m
Candle patternsdaily, weekly
BetaNIFTY 50, daily returns, one year

Equity analytics across the cash market

AI chart and candle detection over the NIFTY 500, on daily and weekly history and on live 5- and 15-minute bars, with beta beside every row and the index each name belongs to.

Every gate in the detector is fitted to hand-labelled formations rather than chosen, and a pattern is never drawn across a missing bar.
NIFTY 50 · 30 Oct expirylot 75
StrikeCE IVPE IVPCR
24,80012.413.91.42
24,90011.813.11.18
25,00011.512.60.94
25,10011.912.20.81

F&O analytics, and the chain read for you

The live option chain with Greeks and implied volatility: where the open interest is building, what the skew is pricing, and which strikes are carrying it.

Beside it, each index’s own daily-move distribution over the trailing year, with the observed coverage printed next to the theoretical one, because index returns have fatter tails than a normal assumes.

Screener500 of 500 scanned
Signal15m double bottom, confirmed
Beta bandhigh, 1.2 and above
Sessiontoday
Names returned7
Save the filter and it runs again tomorrow.

A screener over everything we measure

Narrow the whole universe to the few names that meet your conditions: pattern and candle signals, beta band, option-chain metrics and daily-move statistics, on the session you care about.

It returns a list of names and the measurements behind them. What you do with the list is yours to decide.

Alert fired18:15
Chart pattern confirmed
Conditiondouble bottom, 15m, beta ≥ 1.2
Deliveryin-app · email

Alerts that fire on the edge, not on every pass

Price, pattern, option-chain and index conditions, delivered in-app and by email. Edge-triggered, so a condition that stays true does not mail you again on every scan.

Custom engagementscoping
Your rules, implemented and tested on our history
StackFastAPI · PostgreSQL · Flutter
Deliveryyour infrastructure, with the source
Pricingscoped and fixed before we start

Your rules, and AI-assisted software built to order

Give us the rules and we implement them, run them over our own history beside a matched random-entry control, and hand you the output. The rules stay yours and so does the decision — we do not propose rules and we do not grade them for you.

We also build whole tools for individuals and small desks: a private data pipeline, a reconciliation job, a dashboard that answers one question properly. Tell us what you need

What it is built on

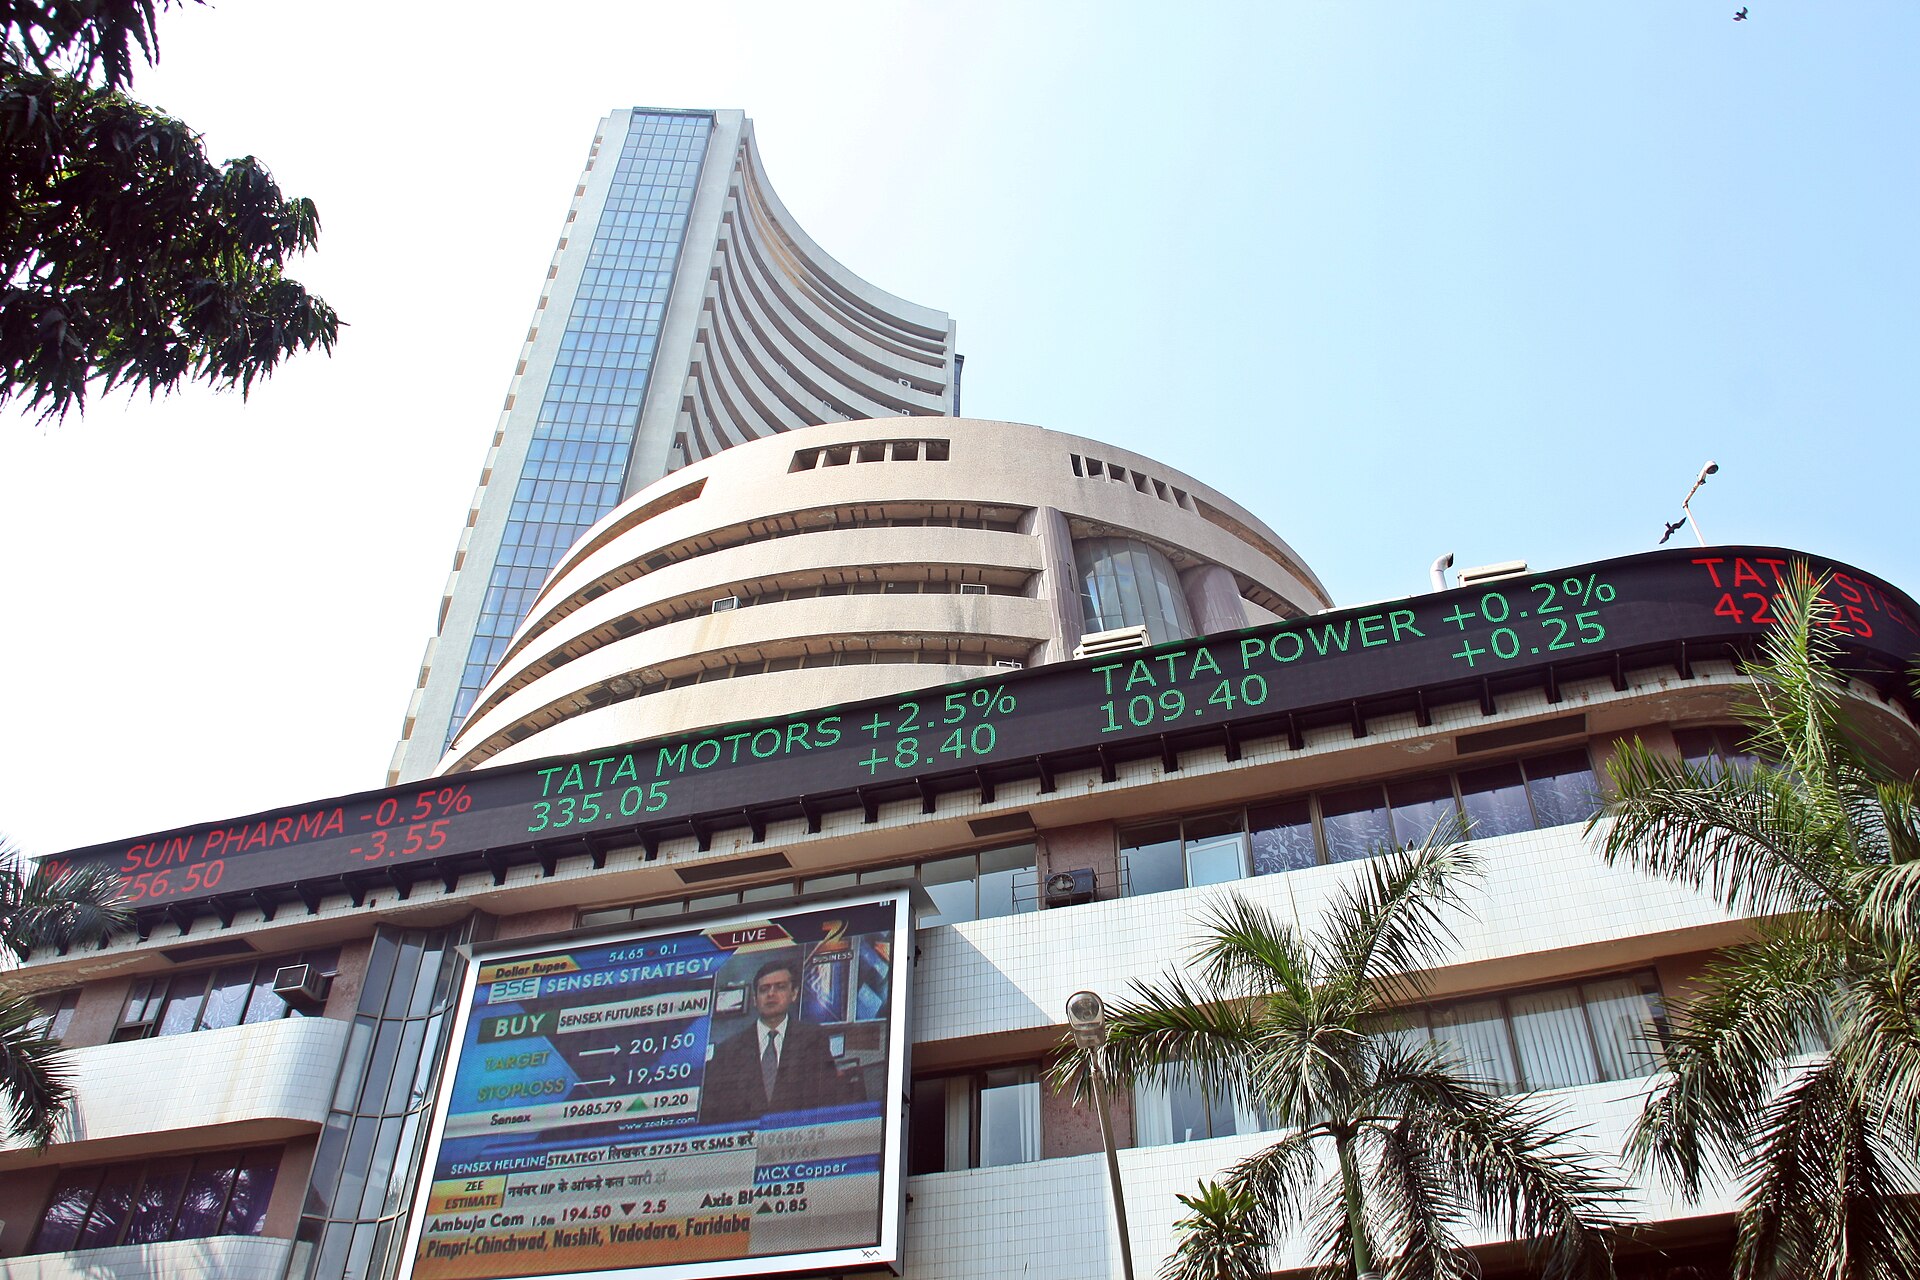
Looking up at the Bombay Stock Exchange tower on Dalal Street, Mumbai, with a live LED ticker running across its facade showing Tata Motors and Sun Pharma quotes.
Dalal Street, Mumbai. Every figure on this page describes this market, and nothing on this page describes a result.
17.7M15-minute bars stored, across 515 instrument tokens
500NSE equities in the covered universe, cash and derivatives
77five-minute buckets in a session, 09:15 to 15:35
40NSE indices with full constituent membership mapped
12scheduled jobs a day that load the data and then audit it
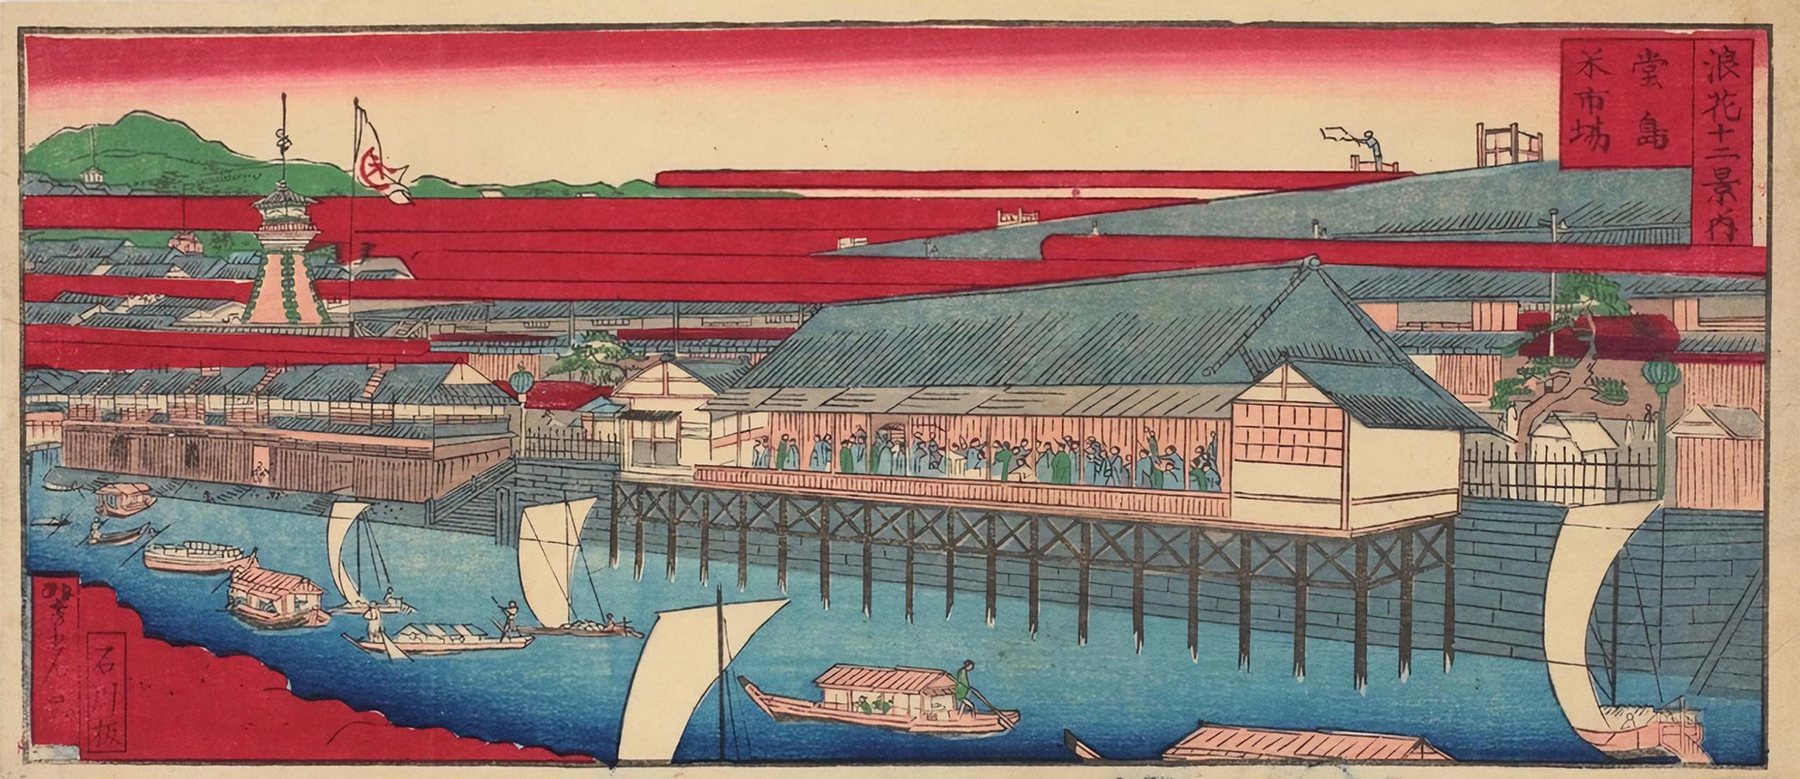
A late-19th-century Japanese woodblock print of the Dōjima rice exchange in Osaka: traders gesturing beneath a long tiled roof raised on piles over the water, with boats below and a crimson sky.
The Dōjima rice exchange, Osaka, by Yoshimitsu Sasaki, c.1880. The world's first futures market, and the place the candlestick chart was invented. Our mark is two of them.

Why we build it this way

Most market products are built to make you feel certain. Ours is built to show you what the data says, and where it stops saying anything, which is a different product and a harder one to sell.

So we built the data first. Every intraday bar we show is one we recorded ourselves from the exchange feed and stored as our own candle. A job runs every night and asks each table, instrument by instrument, whether it is actually current. When something is behind, the product says so instead of quietly serving you a stale close.

On that foundation sit the instruments: AI pattern and candle detection across the cash market, the option chain read with Greeks and implied volatility, a screener over the whole universe, beta against the NIFTY 50, and alerts.

What we do not do is tell you what to buy. We are not registered as an investment adviser or a research analyst, we publish no returns and no performance figures, and we make no claim about what any screen is worth to you. You get the measurement. The decision stays yours.

If that sounds like the way you think, start the trial. Fifteen days, the whole product, no card.

Quantest Technologies LLP

Building market instruments since 2025

The first principle is that you must not fool yourself — and you are the easiest person to fool. Richard Feynman

Fifteen days free

Every account starts with fifteen days of Pro, in full: live indices, the option chain, the detectors on every timeframe, the screener and alerts. No card to start. After that it is ₹999 a month.

Compare every plan

₹999 per month
Pro, billed yearly

  • Live 5- and 15-minute AI pattern scanning
  • The screener across the whole universe
  • Every alert condition, in-app and email
  • Beta against the NIFTY 50, across the NIFTY 500

Start free trial

Trial

15 days

The whole of Pro, free, with no card. One trial per account.

Pro

₹999 /mo

Everything free, plus intraday scanning, the screener, alerts and beta filtering.

Custom build

From ₹39,999

AI-assisted software built for one desk: your pipeline, your rules, your infrastructure.

Founding desks: 70% off the first year

The first 100 Pro accounts keep the launch rate for twelve months, and get the custom-build consultation at no charge.

Claim the launch rate

Important information

Read this before you read anything else on our screens. It is the shortest honest description of what we are and what we are not.

Investments in the securities market are subject to market risks. Read all the related documents carefully before investing.

We are a software company, not an adviser

Quantest Technologies LLP builds analytics software. We are not registered with SEBI as an Investment Adviser or as a Research Analyst, and we are not a stock broker, a portfolio manager or a distributor of any product.

Nothing here is advice or a recommendation

No screen, alert, signal, screener result or page on this site is investment advice, a research report, or a recommendation to buy, sell or hold any security. Our outputs are statistical rules applied to price data. They describe what has formed; they do not predict what will happen next.

We publish no returns and no performance figures

We do not advertise profits, expected returns, win rates or backtested results, on this site or anywhere else. Past behaviour of a price, a pattern or a strategy is not a reliable indicator of future results, so a number of that kind on a marketing page is worth less than the confidence it buys.

We never touch your money or your orders

We do not hold client funds or securities, place orders, accept trading authority, or execute anything on your behalf. There is no profit-sharing arrangement of any kind.

Data can be wrong, and derivatives can lose you money

Market data reaches us from a licensed broker feed and may be delayed, incomplete or incorrect. Check anything you act on against your broker or the exchange. Trading in derivatives carries a substantial risk of loss and is not suitable for every investor.

Grievances

Write to us and a person answers, normally within one working day. If something we show you is wrong, tell us and we will publish the correction.

support@quantest.in

Questions

What exactly do I get?
Five things on one data foundation: equity analytics across the NSE cash market, F&O analytics with the live option chain, a screener over the whole universe, alerts, and software built to order. Everything is measurement and tooling; none of it is a recommendation.
Is this investment advice?
No. Quantest is analytics software. We are not registered with SEBI as an Investment Adviser or a Research Analyst, nothing in the product is a recommendation to buy or sell, and derivatives trading carries a substantial risk of loss. The full position is here.
Why do you not show returns or backtested results?
Because a performance figure on a marketing page is the easiest number in this industry to produce and the hardest to justify. Past behaviour does not predict future results, and showing a return would imply a claim we are not in a position to make. We sell the instruments and the data discipline, and we let you measure your own rules inside the product.
Which markets and instruments do you cover?
Indian equities and index F&O: NSE cash and NFO, with SENSEX and BANKEX on the futures ticker. The heatmap is NSE only, and 40 of the 50 NSE indices carry full constituent membership you can drill into.
Where does the data come from?
A licensed broker market-data feed, recorded tick by tick and stored as our own candles. Intraday bars are built from ticks rather than re-downloaded, and a nightly audit checks every table per instrument before anything is called current.
Can you build something just for me?
Yes. Two shapes: your own rules implemented and run over our history, or a whole tool built for your desk — a private data pipeline, a reconciliation job, a dashboard that answers one question properly. Tell us what you need.
What does the free trial include?
Everything Pro has, for fifteen days: live index prices and the heatmap, the full option chain with its interpretation, pattern and candle detection on every timeframe, the screener and alerts. No card to start, and nothing is charged automatically when it ends.

Send the weekly market note to

One email on Monday: what the week’s data showed and what changed in the platform. No tips, no calls, no positions. Unsubscribe in one click.

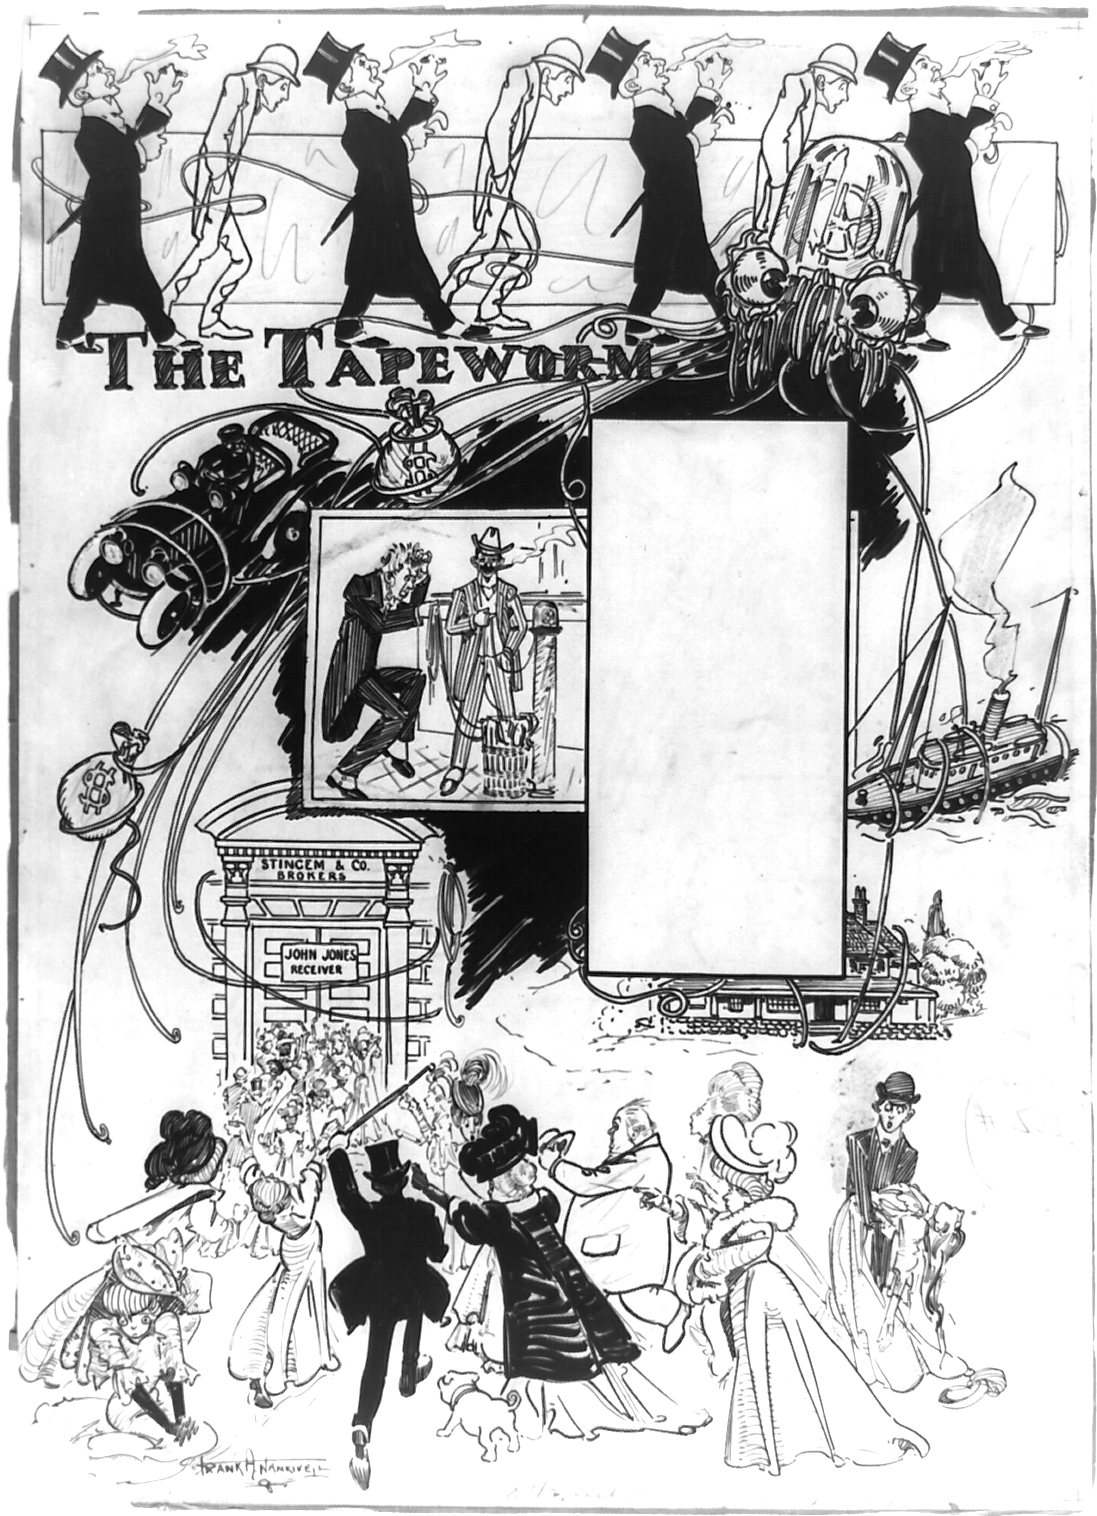
A 1907 pen-and-ink cartoon titled “The Tapeworm”: top-hatted brokers walking a ticker-tape ribbon that winds through a broker's office, a wrecked ship and a crowd in the street.
“The Tapeworm”, Frank Arthur Nankivell, 1907. The tape has always promised more than it knew.